Free printable worksheet
Periodic Table Trends Worksheet
Twelve quantitative periodic table trends problems using chemical relationships, calculations, and data analysis.
ChemistryGrades 9-124 pagesAnswer key included
No email is required. Download the complete worksheet and answer key now.
Download the free PDF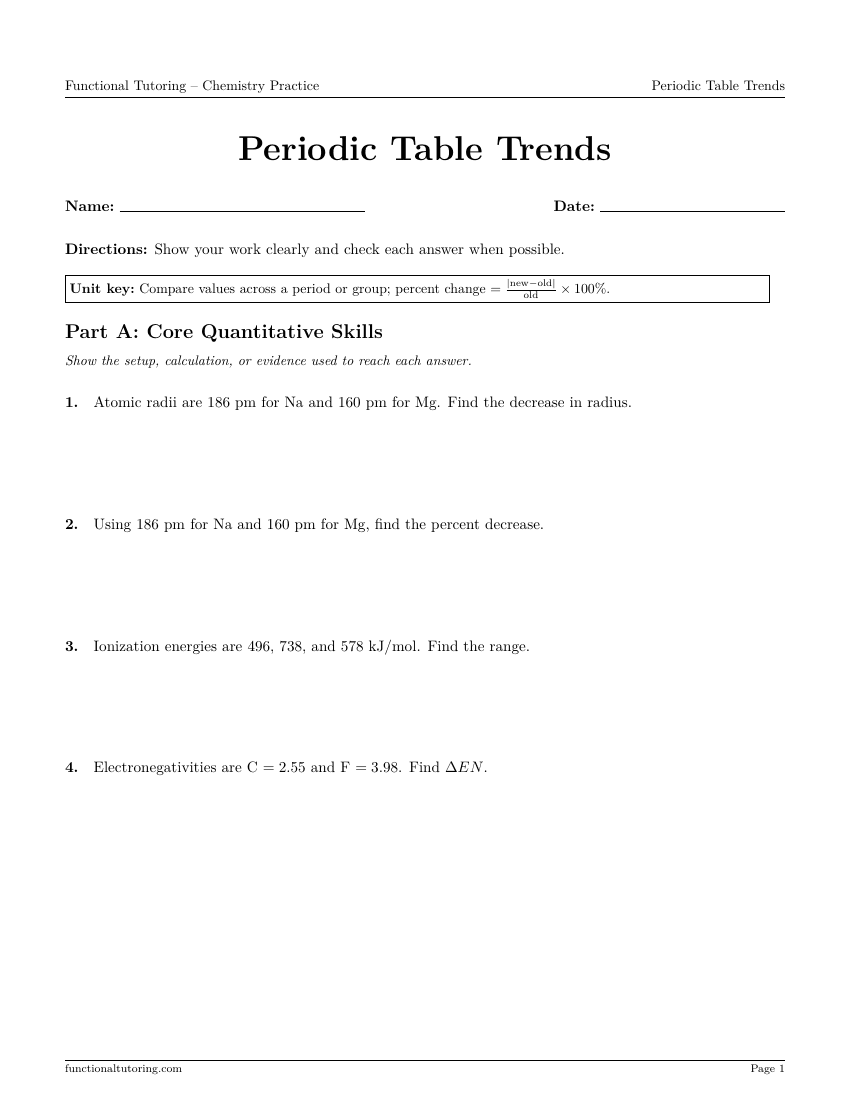
What this worksheet includes
- Twelve quantitative periodic table trends problems using chemical relationships, calculations, and data analysis.
- 4-page printable PDF with a complete answer key
- Designed for Grades 9-12 chemistry practice
- Available as an immediate free download with no email required
How to use it
Use this periodic table trends worksheet for guided practice, independent review, homework, tutoring sessions, or a quick skills check. The spacious layout is designed to leave room for students to show their work rather than guess from crowded answer choices.
After students finish, compare their reasoning with the included answer key. When an answer is incorrect, have the student locate the first step where their work changed direction before trying the problem again.
Who this practice is for
This resource is designed for grades 9-12 students working on chemistry. Teachers, tutors, homeschool families, and parents can preview the first page before deciding whether the level and spacing fit the student.
Looking for a broader sequence? Browse all Chemistry worksheets.
Topic guide
How to approach periodic table trends
Periodic Table Trends becomes easier when students translate the given data into a measurable relationship before calculating. Twelve quantitative periodic table trends problems using chemical relationships, calculations, and data analysis.
This chemistry worksheet progresses from direct quantitative relationships to multi-step chemical applications. Students balance units, formulas, particles, and coefficients while checking whether each result is chemically reasonable.
Learning objectives
- Apply quantitative relationships used in periodic table trends
- Track units, chemical formulas, coefficients, and significant figures
- Check calculated results using conservation and chemical meaning
Skills to review first
- Core scientific relationships connected to periodic table trends
- Fractions, percentages, ratios, and one-variable calculations
- Reading units, tables, formulas, and scientific notation
Worked example
Follow the reasoning step by step
Solve one representative quantitative periodic table trends problem from Part A.
- List the given data and identify the requested quantity.
- Choose the relationship, ratio, probability rule, or conversion that connects them.
- Substitute carefully and carry units or labeled counts through the calculation.
- Check the scale of the result and explain what it means scientifically.
Solution: A complete solution includes the setup, calculation, labeled result, and a brief scientific interpretation when appropriate.
Try before downloading
Three sample problems
Work each problem, then open the answer to check your result.
An atomic radius drops from to across a period. Find the percent decrease.
Show answer
Electronegativities are and . Calculate their difference.
Show answer
Error check
Common mistakes to watch for
- Using an unbalanced equation or an incorrect chemical formula
- Mixing units or applying a mole ratio before converting to moles
- Reporting a calculator result without units, precision, or a chemical reasonableness check