Free printable worksheet

Graphing Linear Equations Worksheet

Nine coordinate-plane problems with completed line graphs in the answer key.

Middle School MathGrades 7-86 pagesAnswer key included

No email is required. Download the complete worksheet and answer key now.

Download the free PDF
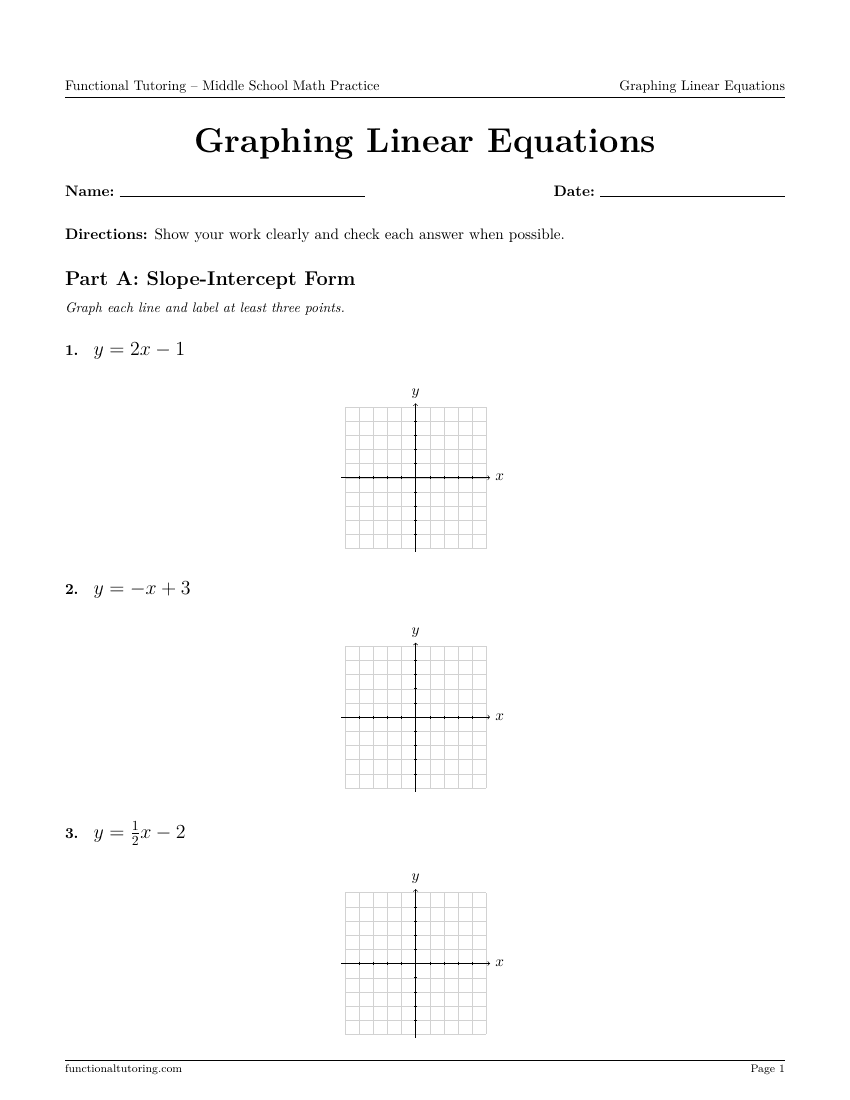
First-page preview of the Graphing Linear Equations worksheet
First-page preview—no email required.

What this worksheet includes

  • Nine coordinate-plane problems with completed line graphs in the answer key.
  • 6-page printable PDF with a complete answer key
  • Designed for Grades 7-8 middle school math practice
  • Available as an immediate free download with no email required

How to use it

Use this graphing linear equations worksheet for guided practice, independent review, homework, tutoring sessions, or a quick skills check. The spacious layout is designed to leave room for students to show their work rather than guess from crowded answer choices.

After students finish, compare their reasoning with the included answer key. When an answer is incorrect, have the student locate the first step where their work changed direction before trying the problem again.

Who this practice is for

This resource is designed for grades 7-8 students working on middle school math. Teachers, tutors, homeschool families, and parents can preview the first page before deciding whether the level and spacing fit the student.

Looking for a broader sequence? Browse all Middle School Math worksheets.

Topic guide

How to approach graphing linear equations

A linear equation graphs as a straight line. Slope-intercept form reveals the starting point on the y-axis and the repeated rise-over-run movement.

Standard-form and special lines may need a different approach. Plot at least three points, draw one straight line, and compare with the completed graph in the answer key.

Learning objectives

  • Graph from slope-intercept form
  • Rewrite and graph standard form
  • Graph vertical and horizontal lines

Skills to review first

  • Ordered pairs
  • Coordinate planes
  • Slope as rise over run
Worked example

Follow the reasoning step by step

Graph y = −½x + 3.

  1. Plot the y-intercept (0, 3).
  2. Use slope −½: move right 2 and down 1.
  3. Plot (2, 2) and (4, 1).
  4. Draw a straight line through the points.

Solution: A decreasing line through (0, 3), (2, 2), and (4, 1).

Try before downloading

Three sample problems

Work each problem, then open the answer to check your result.

Problem 1 · positive slope

y = 2x − 1

Show answer

Use (0, −1), (1, 1), and (2, 3).

Graph of y equals 2x minus 1xy-5-4-3-2-112345-4-224
Graph of y equals 2x minus 1
Problem 2 · standard form

2x + y = 4

Show answer

Rewrite y = −2x + 4.

Graph of 2x plus y equals 4xy-5-4-3-2-112345-4-224
Graph of 2x plus y equals 4
Problem 3 · special line

y = −3

Show answer

Horizontal line through y = −3.

Horizontal line y equals negative 3xy-5-4-3-2-112345-4-224
Horizontal line y equals negative 3
Error check

Common mistakes to watch for

  • Using run over rise
  • Drawing vertical lines for y = a constant
  • Plotting only one point